D3. Reports🔗
At a glance🔗
The Reports screen brings together your in-depth management analyses across 9 tabs: food cost, real margin, inventory variances, production forecast, stock rotation, purchases, waste, and the Z (closures) and X (live) register reports. It's the tool for steering profitability and keeping compliant accounting.
Who / when🔗
For the manager who steers costs and profitability, prepares an inventory, anticipates production, or produces register records. Consult it daily (X report), at the end of the day (Z report) or periodically (food cost, margin, purchases, waste).
How to get there🔗
Management → Reports
Prerequisites🔗
🔑 Reports rights (CSV export requires the data export right; printing requires the report printing right)
Screen tour🔗
A tab bar at the top gives access to the 9 reports. For most of them, a period selector filters the data (except Food cost and Stock rotation, which reflect the current state). Most reports offer a CSV button to export the displayed table.
The 9 tabs🔗
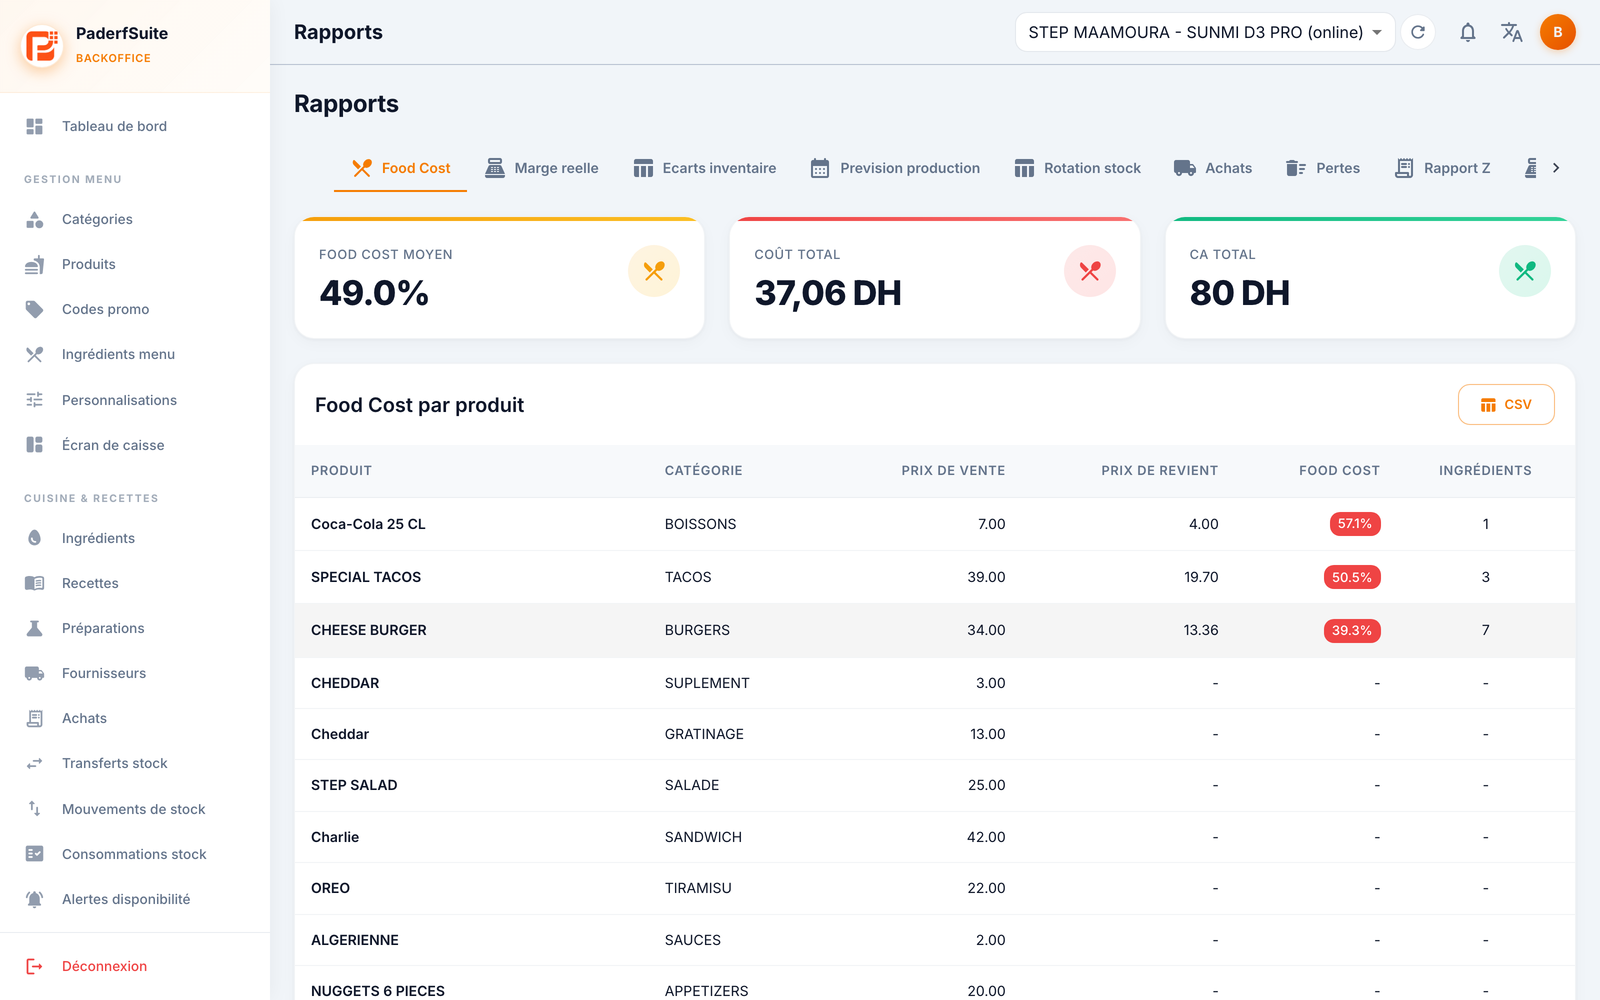
- Food cost: material cost per product. Indicators Avg. food cost, Total cost, Total revenue, then a table per product (selling price, cost price, food cost in % colored, number of ingredients).
- Real margin (COGS): real margin calculated from the cost of goods sold.
- Inventory variances: differences between theoretical stock and counted stock.
- Production forecast: helps anticipate the quantities to produce.
- Stock rotation: how fast ingredients move.
- Purchases: analysis of purchase orders and supplier spending.
- Waste: losses and waste over the period.
- Z report: the register closures and their detail.
- X report: a live view of the register, without closure.
The detail of Z and X reports🔗
The register reports present a detailed view: sales, cash and movements (floats, payouts), counters, payments, VAT, breakdowns by order type / category / product / employee, an hourly chart, as well as the NF525 compliance elements and the electronic signature.
Step-by-step procedures🔗
Analyze your food cost🔗
- Open the Food cost tab.
- Read the Avg. food cost at the top, then spot in the table the products whose percentage is high (shown in red).
- Export via CSV if needed for external tracking.
View a report over a period🔗
- Open the desired tab (Margin, Purchases, Waste…).
- Set the period selector.
- The table and indicators update; export to CSV if needed.
Take stock of the register during the day (X report)🔗
- Open the X report tab.
- Review the live state (sales, payments, cash float) without closing the day.
View a closure (Z report)🔗
- Open the Z report tab.
- Select the closure to examine to display its full detail (sales, VAT, payments, NF525 signature).
- Export or print according to your needs and your rights.
Messages & edge cases🔗
- The Food cost and Stock rotation tabs offer no period selector: they reflect the current state.
- In the food cost, a product without a recipe shows a dash (cost price and food cost not computable): enter its recipe to obtain the cost.
- The Z report corresponds to a definitive closure and carries the NF525 signature: it's the reference document for your accounting.
- The CSV export and the printing depend on your Reports rights.
Tips🔗
- The food cost per product immediately points out the recipes to review (selling price too low or material cost too high).
- The inventory variances and the waste, read together, often explain a margin drift.
- Keep your Z report exports: they constitute a fiscal record, complemented by the audit log.