C1. Sales & Statistics🔗
At a glance🔗
The Sales & Statistics screen is your restaurant's commercial dashboard. It brings together, on a single page, your revenue, your tickets, your payment methods, your best-selling products and the detail of every transaction, over the period you choose. It's the tool that answers "How did we do today?" or "How is my month shaping up?".
Who / when🔗
For the manager who tracks day-to-day activity or takes stock at the end of the week, month or season. Use it to measure a promotion, compare two periods, spot peak hours or look up a specific sale.
How to get there🔗
Sales → Sales & Stats
Prerequisites🔗
🔑 Reports rights (sales viewing; CSV export requires the data export right)
Screen tour🔗
In the top right, two selectors drive the whole page:
- The period selector: today, yesterday, this week, this month, this quarter, this semester, this year, or a custom range.
- The comparison selector: compares the chosen period to the previous period to measure progress.
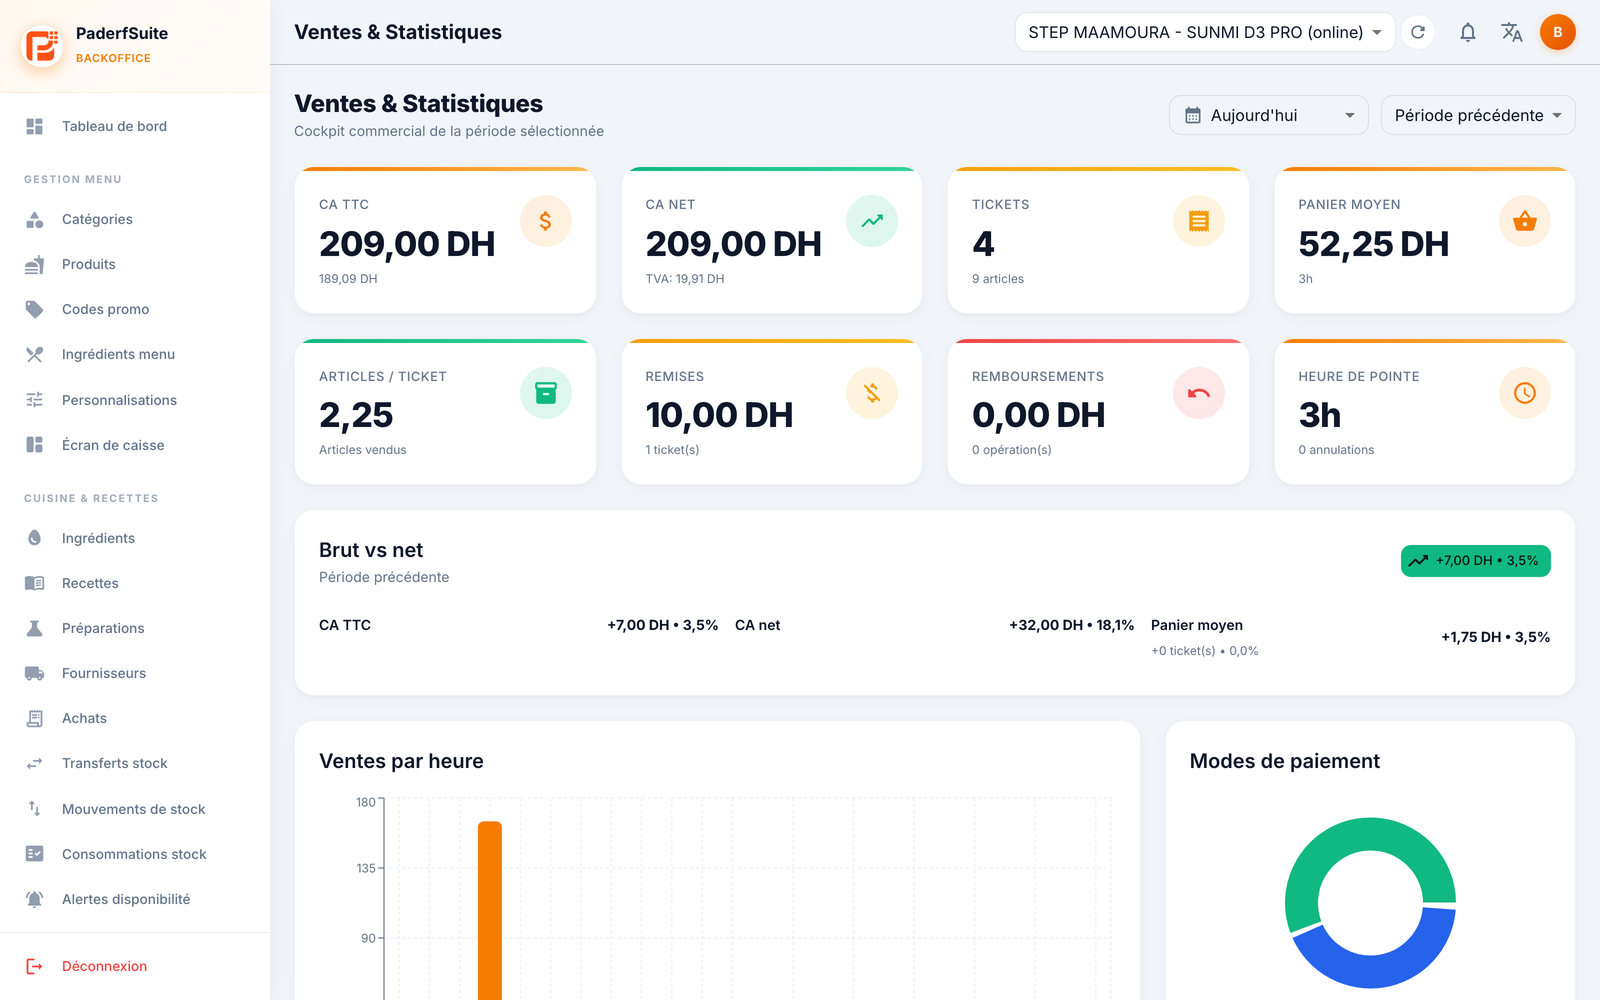
The 8 key indicators🔗
- Revenue (incl. VAT): gross revenue including all taxes.
- Net revenue: revenue excluding VAT (the VAT amount is shown just below).
- Tickets: number of transactions (with the number of items sold).
- Avg. basket: average amount per ticket.
- Items / ticket: average number of items per sale.
- Discounts: total discounts granted (and the number of tickets affected).
- Refunds: total refunded (and the number of operations).
- Peak hour: the busiest time slot (and the number of voids).
Cards and charts🔗
- Gross vs net: shows how revenue (incl. VAT), net revenue and the average basket have evolved compared to the comparison period (variations in DH and in %).
- Breakdown by register: if your restaurant has several registers, this card splits revenue register by register.
- Sales by hour: a bar chart showing how revenue is spread across the day.
- Payment methods: a pie chart breaking down takings by payment method (cash, card…).
- Sales by order type: dine in, take away, delivery…
- Control block: summarizes discounts, refunds and voids.
- Employee performance: the revenue generated by each employee.
- Top categories and Top products: your best-selling families and items.
Sales journal🔗
At the bottom of the page, the sales journal lists every sale with the columns: number, date, type, source, register, order type, status, items, amount, payment and employee. A search and filters let you target a sale, and the Export CSV button downloads the journal.
Step-by-step procedures🔗
Change the analysis period🔗
- Open the period selector in the top right.
- Pick a preset period, or Custom to enter a start and end date.
- The whole page (indicators, charts, journal) updates.
Compare two periods🔗
- First set the period to analyze.
- Open the comparison selector and choose Previous period.
- The variations appear in the Gross vs net card and on the relevant indicators.
Find and view a transaction🔗
- Scroll down to the sales journal.
- Use the search or the filters to target the sale.
- Click the row to open the transaction details: ticket totals and ticket lines with, for each item, the cost, the margin and the food cost.
Export the sales🔗
- Set the period and filters you want.
- Click Export CSV: the journal is downloaded in spreadsheet format (usable in Excel or for your accountant).
Messages & edge cases🔗
- The breakdown by register only appears if several registers are attached to your establishment.
- The figures refresh in real time: a sale cashed on the register is reflected here without reloading the page.
- The food cost and the margin shown in a transaction's details depend on the recipes and ingredient costs you've entered; without a recipe, the line stays blank.
Tips🔗
- Comparison to the previous period is the fastest way to tell whether a promotion or a menu change has paid off.
- The peak hour helps you align your team schedules with the reality of your activity.
- Keep an eye on discounts and refunds in the control block: a drift may signal a need to review your sensitive action authorizations.