B11. Waste & Loss🔗
In short🔗
This screen measures your restaurant's waste: how much it costs you, at what rate, and for what reasons. Three indicators and a chart give you the big picture, and a table details each recorded loss. You can also record a new loss directly from this page.
Who / when🔗
For the manager who tracks costs and wants to cut waste: check it regularly to identify loss causes, and use it whenever a breakage or expiry occurs.
How to get there🔗
Kitchen & Recipes → Waste
Prerequisites🔗
🔑 View stock (Manage stock to record a loss)
Screen tour🔗
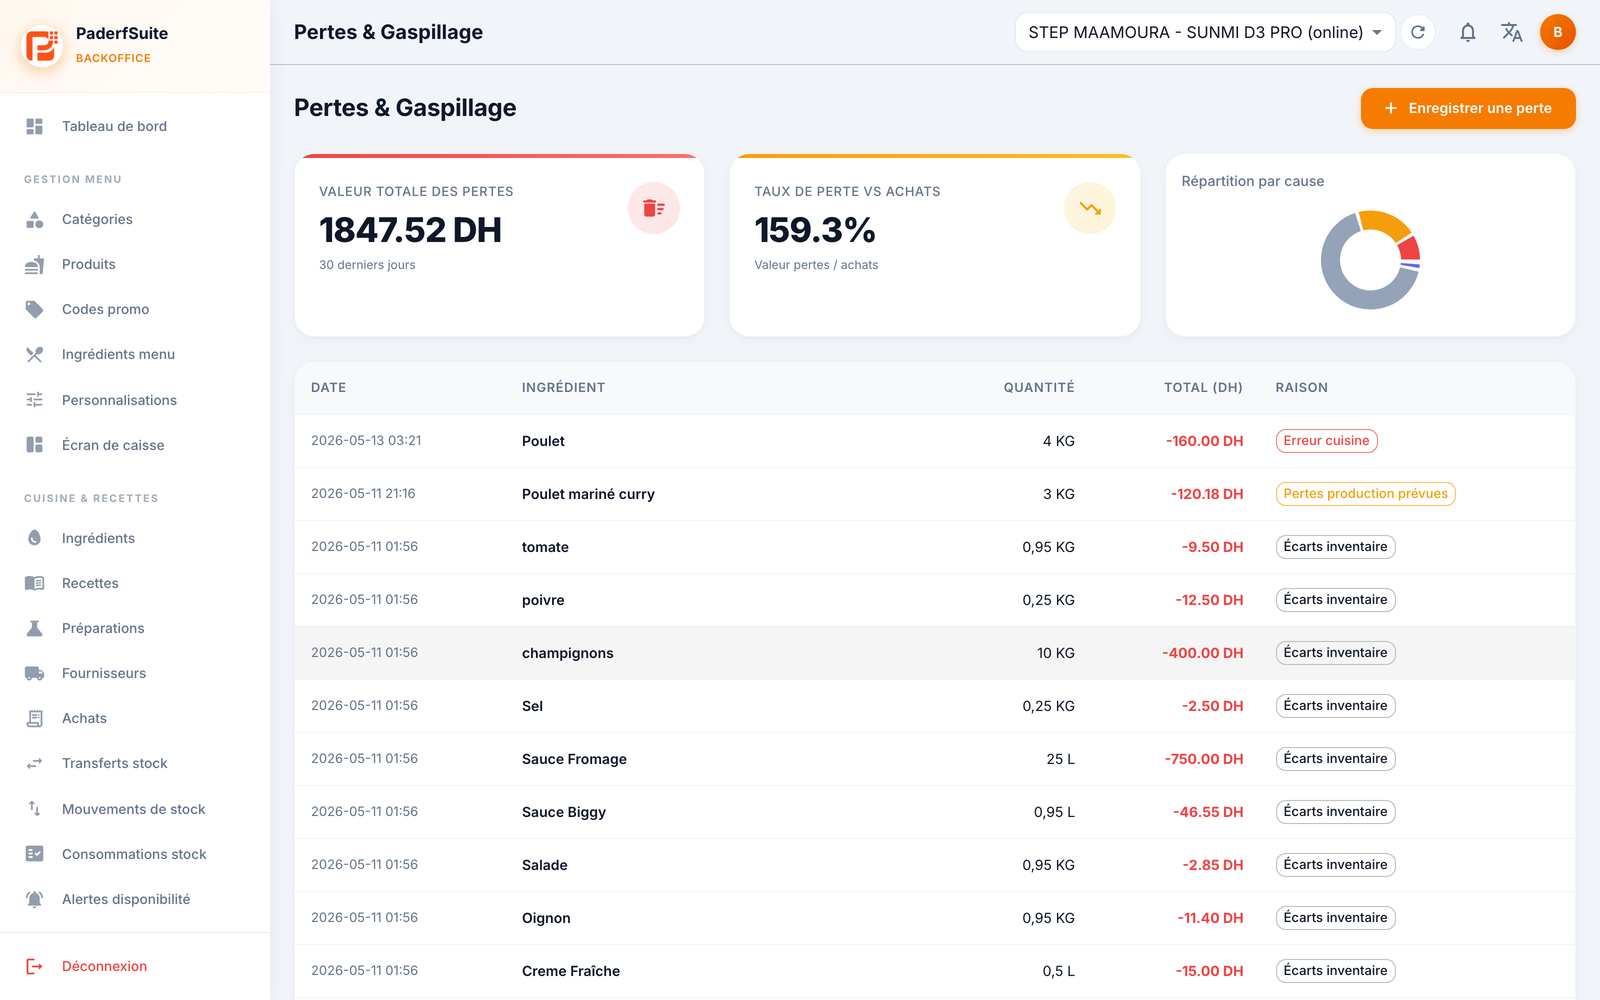
At the top, three key indicators:
- Waste value (30 days): the total amount lost over the last month, in DH.
- Waste rate: the share of stock lost, as a percentage.
- Breakdown by cause: a pie chart that splits losses by reason.
The table then lists each loss with the following columns, in order:
- Date: date and time of the loss.
- Ingredient: the ingredient involved.
- Quantity: the quantity lost.
- Total (DH): the value of the loss.
- Reason: the motive (expiry, breakage, error, etc.).
Step-by-step🔗
Record a loss🔗
- Open the loss-recording dialog.
- Fill in the fields:
- Ingredient: the ingredient lost.
- Quantity: the number of units.
- Reason: the reason for the loss.
- Photo: a photo proof.
- Confirm. The loss appears in the table and the indicators update.
Messages & edge cases🔗
- The waste rate relates the lost value to your activity: a rising rate should flag a problem with storage, portioning, or supply.
- The by-cause pie chart is the fastest tool for targeting the priority action (for example, too many expiries = review ordered quantities).
Tips🔗
- A loss recorded here generates a matching stock movement, viewable in B7. Stock Movements.
- For detailed historical tracking, the Waste report on the Reports screen complements this view.